Notes on troubleshooting high CPU usage in Windows
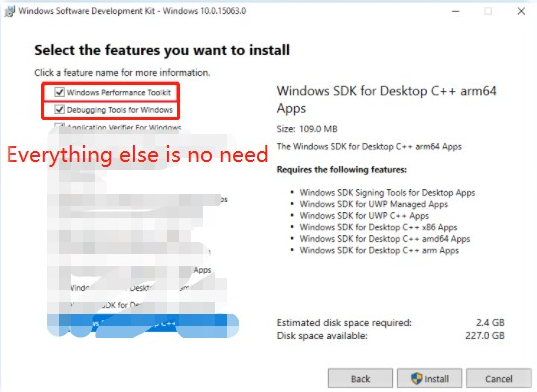
Install the Windows Performance Toolkit.
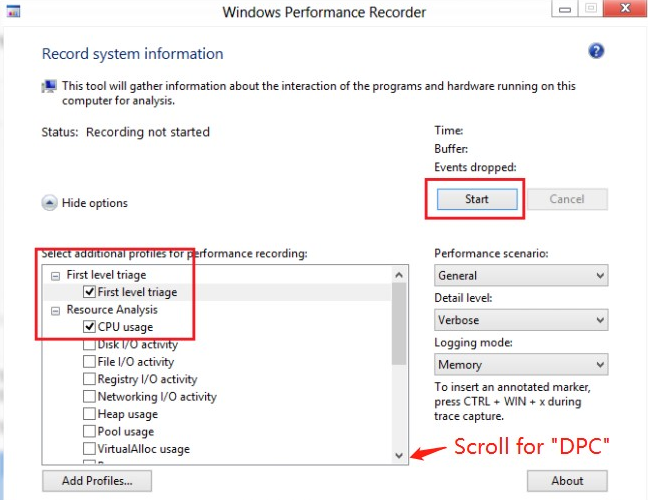
Start the Performance Recorder after the installation finishes. Expand options, check “First Level Triage”, “CPU Usage”, and “DPC Latency”. Then Click “Start”
Leave the recorder running for about 1 minute, then Save to an ETL file.
Open the ETL file in the Analyzer, click Trace > Load Symbols, wait for a while until the symbols are loaded.
Finally you can inspect the details in the panels to find out the exact reason.
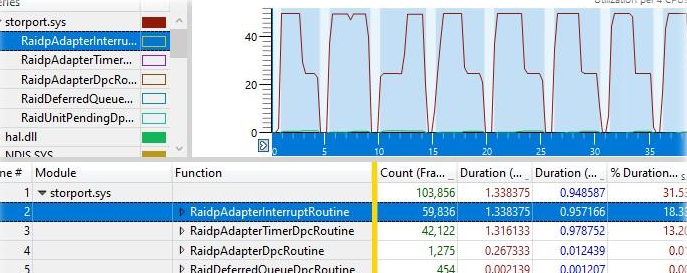
In my case, I expanded Computation and dragged DPC/ISR to the right panel. Then clicked the spiking curve, and saw storport.sys was selected below. Expanded and saw a bunch of RaidXYZ functions. So it was the RAID controller causing the issue.
Notes on troubleshooting high CPU usage in Windows
https://blog.bigpower.dev/Notes-on-troubleshooting-high-CPU-usage-in-Windows/